Projects
The following projects and educational resources have been developed during my time at Google, Bocoup's DataVis team, IBM Reserch's Visual Communication Lab, and in my own time.
Google Search, Jobs

Measurement Lab Visualizations
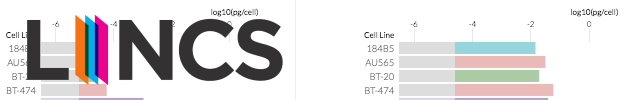
LINCS Cancer Browser
Stereotropes
Npm By Numbers - A visualization of the npm ecosystem
MobileVis - Data Visualization on Mobile Devices

Learn JS Data

Bl.ocksplorer.org

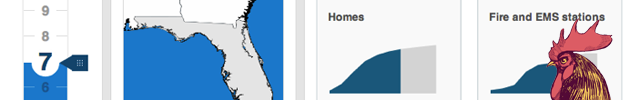
Climate Central, Surging Seas Risk Finder (Bocoup)
OpenVis Conf (Bocoup)

The Miso Project (Bocoup + Guardian Interactive Team)

The Business of US Food Aid (with Guardian Interactive Team)

Somalia Famine - How the World Reacted (with Guardian Interactive Team)
Startup Data Trends - For all your startup data needs
NYTWrites - Exploring The New York Times Authorship
IBM Many Bills: A Visual Bill Explorer
A Day of MBTA

IBM Many Eyes

The New York Times Visualization Lab
Open Source
The Miso Project - d3.chart Library
d3.chart is a framework for creating reusable charts with d3.js
The Miso Project - Storyboard Library
Storyboard is a JavaScript library for managing the flow of interactive content and general application control flow logic.
The Miso Project - Dataset Library
Dataset is a JavaScript client-side data transformation and management library. Dataset makes managing client-side data easy by handling loading, parsing, sorting, querying & manipulating data from all sorts of sources. The Miso Project is a collaboration between Bocoup and the Guardian Interactive Team.
d3.chart.base
A d3.chart based chart that can be used as the basis for all other d3.charts.
It provides convenience functionality like handling dimensions as well as handling modes.
PatternFills
A collection of svg-based pattern fills that can be used both as SVG patterns defs and CSS background image urls.